Gumption Boros#
Hi everyone, time to pick over the bones of this dead format to see if we can glean any scraps of insight for the next one! I’ll be examining the public data from the first five weeks of TDM Premier Draft, so naturally any conclusions below apply only to that format during that period.
First, I’m going to take a look at the success of drafting using various metrics, as I did with Aetherdrift. My previous results have shown that DEq and GIH WR are the only viable numbers to use to guide early picks, so we’ll start with that. This time, DEq performed significantly better, so we’ll dive into the differences to see where GIH WR might be going wrong, and where DEq found value that people missed. I won’t explain DEq in this article and will reference it heavily, so please peruse the resources linked on this site for a deeper explanation. I also intend to flesh it out and publish it to the web over the course of Final Fantasy, which I’m skipping (this is done). I did play TDM after a long break and was able to crack the top 100 during both April and May by trusting in my analytics.
Next we’re going to use a variation of DEq to simulate a soft-force of the two dominant strategies of the format, “Dragons” (or “Soup”) and “Mardu”, which typically meant Boros or Boros with a light splash. I’ll pick out some cards to artificially boost, then repeat the P1P1 substitution analysis. The reason I’m using this analysis to approach this question is that it’s the only method I know of to really dive into the effect of decision making on outcomes without being exposed to significant selection bias. When we look at a win rate by itself, whether for a card or achetype, we’re also looking at the influence of lots of other variables that could affect our interpretation. A P1P1 is relatively “clean”, and once we control for the skill of the player choosing a card, we should have a good estimate of the impact of this particular choice. Card-by-card the results can be extremely noisy, but I’ve found it to be a useful way to approach macro questions like this, and indeed the results were cool and surprising!
It appears that players of all skill levels, especially the strongest players, would have benefitted from a much stronger tilt in the direction of Boros and away from soup-ish cards besides the most powerful bombs. We’ll ask some questions about what drives that effect and whether there might be an exploitable forcing strategy for future releases, and explain why a horizontal line means gumption.
DEq vs GIH WR#
The first thing I always check when the public data drops is the performance of DEq in making first picks. I want to touch this lightly since I’ve gone into detail on these two metrics in several previous posts, but it’s necessary for introducing the Mardu vs Dragons idea. The idea of this analysis is that a given card ranking combined with a set of opens implies a distribution of first picks that would be made according to that ranking. Given that distribution of first picks, we can weight the results obtained by players of similar skill who started on each of those cards. We do our best to fill in holes in the data in an unbiased way, then aggregate the results. This is the best approach I can think of directly measuring the effects of decision-making using the available data.
I want to survey the whole five weeks of available data, so I’ll use a ranking using data averaged over days 1 through 31, and apply that ranking to events played on days 4 on, up through day 35. That’s my best attempt at simulating the effects of relying on rankings that evolve over the course of the format, in the hopes that averaging the rankings through time gives a similar distribution of first picks compared to a more temporally precise strategy (which would be tedious if not impossible to simulate accurately).
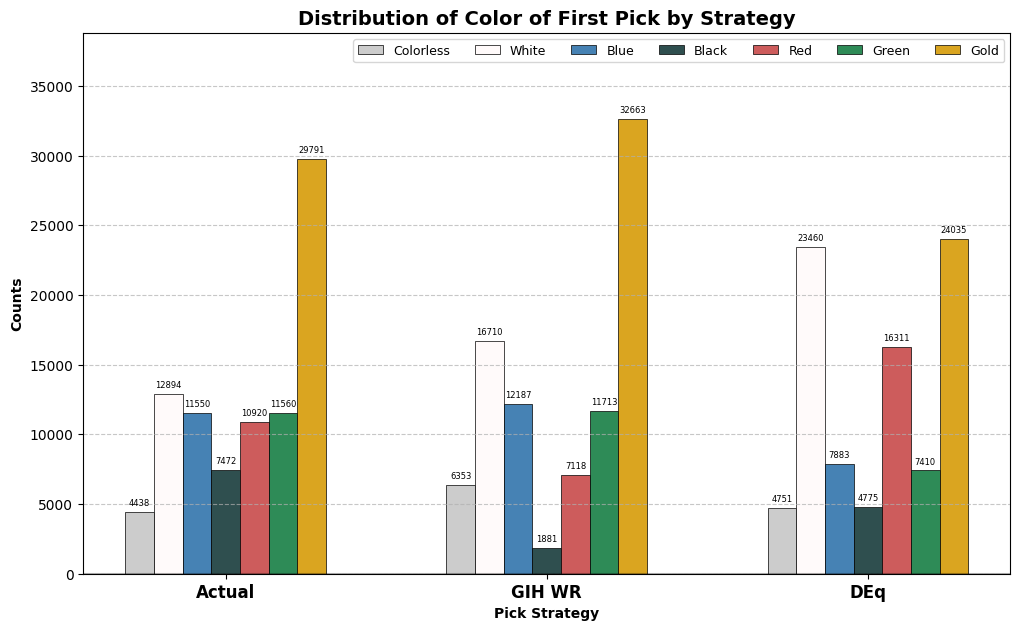
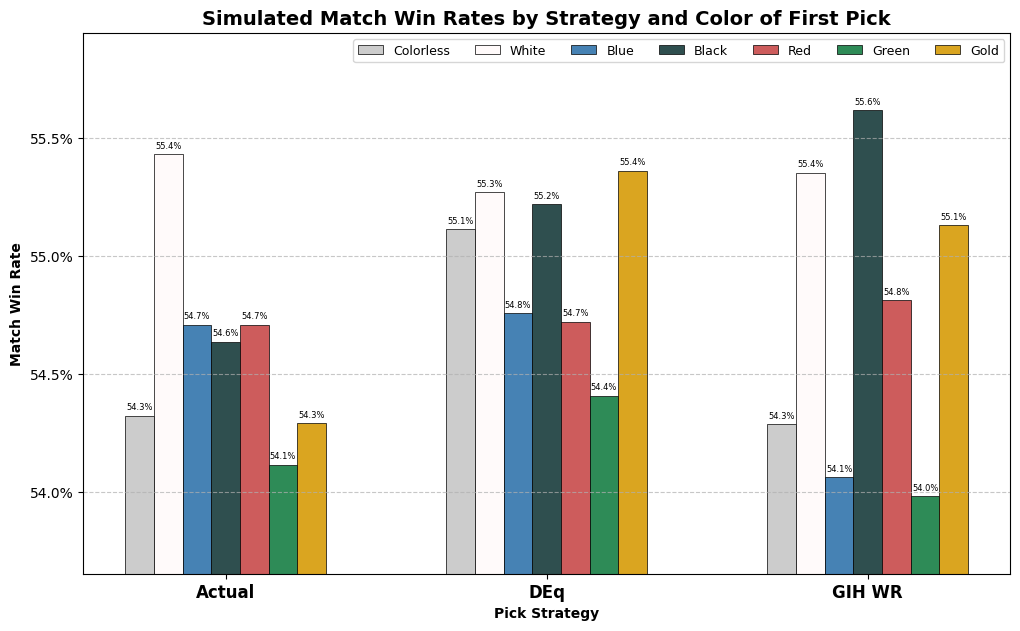
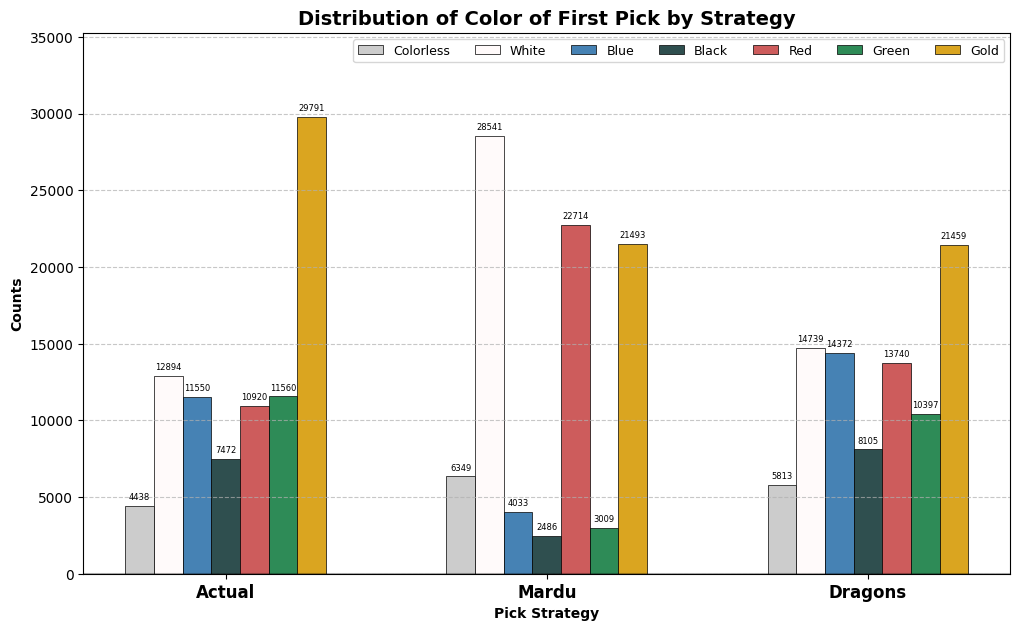
Let’s take a look at the distribution by color of the first picks suggested by DEq and GIH WR, as well as that exhibited in the actual first picks, followed by the simulated and actual win rate data.
from deq.tdm_post import *
counts_bars()
GT(count_totals).tab_header(
    title="Total Observations", subtitle="After Day 3").fmt_integer()
| Total Observations | |
| After Day 3 | |
| Drafts | Matches |
|---|---|
| 88,625 | 453,627 |
In Aetherdrift, we saw that the DEq strategy approximated the color distribution chosen by actual drafters better than GIH WR, but the oppposite seems to be the case here. In a preview of our Mardu vs Dragons results, DEq has a preference for red and white cards over blue, green and black, while GIH WR chooses most colors at a similar rate to actual drafters, except black, which it hates. Let’s see what simulated win rates were achieved.
wr_bars()
GT(total_win_rates).fmt_percent().tab_header(
    title="Simulated Match Win Rate", subtitle="by Strategy, after day 3")
| Simulated Match Win Rate | ||
| by Strategy, after day 3 | ||
| DEq | GIH WR | Actual |
|---|---|---|
| 55.07% | 54.80% | 54.57% |
I consider this a strong result for DEq. Remember, the results are following the usual behavior of drafters from pick two on, so that half percentage point has to be picked up solely from the additive value of the first pick, controlling for skill. Not only did it have the best performance among the strategies, but it achieved a balanced win rate distributed among the various colors, with only the green first-picks coming in below the actual mean win rate in the sample. GIH WR, on the other hand, apparently vastly overrated blue, as usual, as well as green, a color often associated with multi-color strategies in TDM, while significantly underrating the best black cards. DEq got most of its edge thanks to it’s heavy weight on white first picks, as well as picking the strongest multicolor cards to start with and avoiding the traps. Actual drafters took way too many mediocre gold cards, presumably cards like Yathan Roadwatcher that were appealing rares but performed very poorly in the data.
Because of the strong performance of DEq, I will take it as a baseline for card quality as a starting point for a soft-forcing strategy. Note that the strategy is already tilted heavily towards the Boros colors, so a Mardu soft-forcing strategy will be additive to that baseline.
Mardu vs Dragons#
Moreso than any set in recent memory, the community largely fell into two camps as to their approach to the format, which I’m sure you already know all about. So let’s cut to the chase. Mardu or Dragons? What follows is nothing more than a little taste of what a properly considered soft-forcing strategy could look like, since we are simply taking average results of players who took one card or another first overall. The real benefit of soft-forcing comes from developing expertise in a particular archetype, which is not at all taken into account here.
Nevertheless, I think the results were interesting and could point towards discoverable soft-forcing strategies in future formats, if we figure out how to identify them and exploit them correctly. Additionally, we get some insight into the skill question since the analysis evaluates each skill group independently. Is it the case that more skilled players were comparatively better at constructing multicolor dragon decks?
In order to give both approaches a fair shake, I came up with two lists of cards I felt were characteristic to the Mardu or Dragons strategy respectively, and gave a fixed bump to the DEq ratings of cards on the list equivalent to two notches on my grading scale. With the boost, representatives of both strategies would have their opportunity to draft the biggest bombs in the format and take lesser cards at rates proportional to their quality. So, for example, Mardu Devotee, which had an excellent +2.27% DEq, enough for a B, was bumped to +3.77%, or A-, for the purposes of the soft-forcing strategy. I focused on the Boros aspect of Mardu because it was apparent early on that that was the most profitable way to approach the clan, but didn’t try to skew the results overly towards what I consider best, including clunkier cards like Nerev in the Mardu list. A quick note on terminology, I named the specific pick strategies “Mardu” and “Dragons”, so I’ll use those terms when referring to the specific results obtained here. When referring more generally to the archetypes in the set and in the overall data, I might use “Boros” or “Soup” when those terms feel like a better fit.
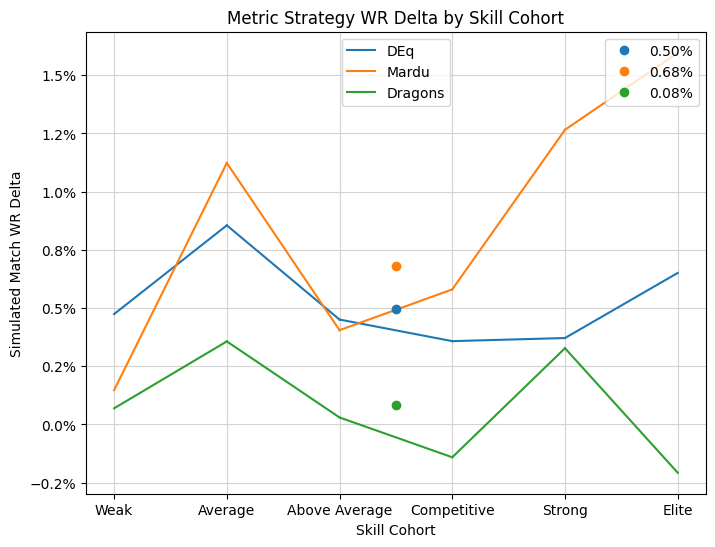
Rather than print the full lists of cards (which can be found in the source code), I will present the results, and then break them down by the most overrepresented cards for each strategy in turn. I first want to break the results down by skill cohort to address the question posed above. We will plot the marginal simulated win rate vs the baseline for the two strategies against skill. The point in the middle and the value in the legend represent the average increase in win rate simulated by the strategy. Was it true, as some suggested, that stronger players would benefit more from drafting complex five-color decks? Let’s see.
from deq.plot import p1_line_plot
from deq.p1_strategy import skill_cohort_table
p1_line_plot(result, metrics=["deq", "deq_mardu", "deq_dragons"])
skill_cohort_table(result)
| Win Rates and Game Counts | ||
| by Skill Cohort | ||
| Skill Cohort | Game Win Rate | Num Games |
|---|---|---|
| Weak | 44.11% | 42201 |
| Average | 48.22% | 79450 |
| Above Average | 53.36% | 159818 |
| Competitive | 59.59% | 106792 |
| Strong | 63.15% | 55651 |
| Elite | 67.57% | 9715 |
Not at all! In fact, the results, while likely somewhat noisy, strongly suggest the opposite: that the very best players had the greatest performance improvement when they biased towards Boros, not soup. For most players, a soft-force of Mardu or Boros was no worse than following “strict” card quality according to DEq and gave a significant performance improvement compared to the actual strategy employed. For the “Strong” and “Elite” groups, players with an average win rate around 65% and a substantial sample size, apparently outstanding results could have been achieved by consistently drafting aggro. The result is somewhat outlying, so one of the questions I always ask is how well the simulated result is supported by the actual data. Because I am reweighting the actual results, a more extreme reweighting means less robust data to support the simulated win rate. The appropriate way to measure this loss of information is, perhaps intimidatingly, by means of an entropy calculation. Let me show the plot of the entropy encoded in the reweighting represented by the various simulated strategies:
p1_line_plot(result, metrics=["deq", "deq_mardu", "deq_dragons"], mode="entropy")
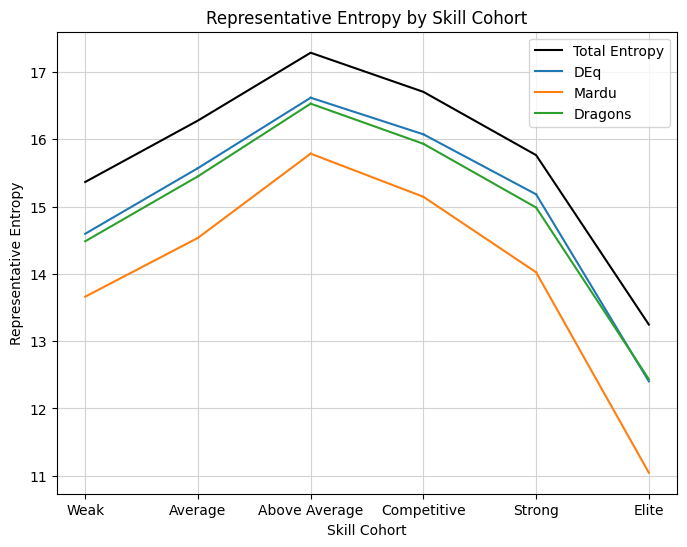
The interpretation of the y-axis is as equivalent “bits” of information, in this case, the information required to identify an average observation in the sample, since we are reweighting a random variable supported on those observations. That should roughly correspond to the variance of that random variable, so the loss of entropy in the Mardu strategy for strong and elite players does mean a greater uncertainty in the simulation. However, 14 bits of remaining entropy represent the equivalent of about 16,000 games worth of support for the estimate, which should be precise within under half a percent. The elite cohort is noisier, with 11 bits of entropy, a sample size equivalent in information to 2000 games, but still likely significant due to the size of the effect. I’ll note that entropy does not map one-to-one mathematically to the variance of the estimator, but I still think it is the best way to understand the information being relied on.
Even with that uncertainty, we can expect that strong and elite players likely would have significantly outperformed baseline by following the soft-forcing strategy given the extreme result of about +1.5%. Before we move on, I think it’s curious that DEq by itself seems to best model elite player behavior, despite being tilted towards Boros, while the further soft force of Boros apparently takes things too far to be palatable to human drafters, but still gave excellent results. In my past observations, the best performing metrics also tended to mirror elite draft behavior the best, but that isn’t quite happening here. Perhaps elite drafters erroneously believed the idea that they were best suited by biasing towards dragons.
Digging In#
Let’s dig in a little deeper. First of all, it makes sense to establish the observed win rates by the colors played in the final deck. We should have expected Boros to outperform just by looking at the color distribution from DEq, so let’s check that split out by skill cohort. For this cut I’ll call it “Boros” and “Soup” since I’m picking out the deck by color combinations. Boros will be WR with or without splash, and “soup” will be represented by decks with three or more base colors and at least four colors including splash:
pl.Config.set_tbl_rows(1000)
boros_v_soup_table()
| Win Rates for Two Archetypes | |||
| by Skill Cohort | |||
| Skill Cohort | Boros or Soup | Game Win Rate | Num Games |
|---|---|---|---|
| Weak | Boros | 49.25% | 3781 |
| Average | Boros | 52.08% | 7990 |
| Above Average | Boros | 56.53% | 16891 |
| Competitive | Boros | 62.19% | 12909 |
| Strong | Boros | 65.38% | 7593 |
| Elite | Boros | 70.91% | 1279 |
| Weak | Soup | 42.65% | 17558 |
| Average | Soup | 47.12% | 34855 |
| Above Average | Soup | 52.71% | 75662 |
| Competitive | Soup | 58.73% | 51878 |
| Strong | Soup | 62.76% | 28221 |
| Elite | Soup | 66.74% | 5003 |
Indeed we see a similar pattern. Boros outperforms significantly for all skill groups, although in this case the edge diminishes rather than increases with skill. Now, these numbers were more or less available over the course of the format, on the invaluable deck color data page, but the limitation of this kind of analysis is that it doesn’t give much information about the counterfactual. Boros decks represented just over 10% of games played by the elite cohort, and soup decks closer to 40%. While we should believe that people would have been better off increasing the number of Boros decks they drafted, it’s impossible to say by how much just from this data. My previous inclination was to believe that, on the balance, DEq would suggest a reasonable rate of the top-performing decks versus the rest. However, based on the soft-force analysis, it looks like things could be pushed even further.
Let me emphasize how this analysis differs from simply scaling up the win rates of the most successful strategies. In order to soft force Boros, it is necessary to take lower quality cards earlier. By premising the analysis on overvaluing available, lower-quality cards, we obtain a realistic and achievable distribution of first picks. Furthermore, the results follow the actual results following those early picks, so we can believe that the simulated results would be achievable given the observed metagame. Obviously, if a large number of people changed their strategy, that would impact the metagame, but we should be able to accept that one drafter following a different strategy would not.
Let’s check back in on that color distribution table comparing the Mardu and Dragons strategies.
counts_bars(["Mardu", "Dragons"])
The Mardu strategy indeeds heavily values red, white, and gold cards, presumably primarily those in Mardu colors, while the dragons strategy is sensibly distributed throughout the color pie. Let’s look at the individual cards favored to see if we can identify the source of outperformance. I’ll give a table of the cards most favored by the Mardu strategy versus the Dragons strategy, then vice versa. Bombs like Marang River Regent that were highly picked by both strategies will be ignored. The “Replaced” win rate is the win rate observed in those drafts where the given card was pointed out by the soft-force strategy, regardless of what card was chosen by the drafter in question, including those where the card in question was actually chosen.
from deq.analytics import metric_summary_display_table

metric_summary_display_table(card_df, 'deq_mardu', name_map, comparison="deq_dragons")
| DEq Mardu High Picks vs DEq Dragons | |||||
| Name | Additional Picks | Simulated Win Rate | Replaced Win Rate | Diff | DEq Mardu |
|---|---|---|---|---|---|
| Mardu Devotee | 3850 | 56.35% | 54.48% | 1.86% | 3.77% |
| Salt Road Packbeast | 3499 | 54.36% | 54.08% | 0.27% | 3.67% |
| Shock Brigade | 2321 | 54.89% | 54.15% | 0.74% | 2.98% |
| Fortress Kin-Guard | 1883 | 57.31% | 53.12% | 4.19% | 2.82% |
| Sunset Strikemaster | 1852 | 55.11% | 53.64% | 1.47% | 4.12% |
| Descendant of Storms | 1563 | 54.36% | 54.49% | −0.13% | 4.40% |
| Wind-Scarred Crag | 1558 | 58.82% | 53.58% | 5.25% | 2.85% |
| Frontline Rush | 1480 | 55.84% | 53.62% | 2.22% | 4.34% |
| Sunpearl Kirin | 1352 | 53.54% | 53.84% | −0.30% | 3.51% |
| War Effort | 1318 | 54.76% | 53.74% | 1.02% | 3.47% |
The strongest outperformers were some of the most characteristic aggressive Boros cards, particularly Fortress Kin-Guard, Frontline Rush, and Mardu Devotee. Descendant of Storms and Sunpearl Kirin, acknowledged premium uncommons, showed a weaker performance, but we shouldn’t overindex on individual results which are noisy. The overriding impression is the consistent outperformance of the bread-and-butter Boros cards. This is something that was not predicted by DEq, which is attentive to game results and pick order. For example, Kin-Guard had a DEq value of +1.32%, which is solid but below par for a P1P1 by about a full percent, and not the kind of thing that would lead to the results seen here, due to its late-pack ATA of about 6.5. Is there a consistent phenomenon explaining the difference? Maybe. We’ll take a look at some elucidating charts below, but first let’s see the same table for the Dragons results.
metric_summary_display_table(card_df, 'deq_dragons', name_map, 10, comparison="deq_mardu")
| DEq Dragons High Picks vs DEq Mardu | |||||
| Name | Additional Picks | Simulated Win Rate | Replaced Win Rate | Diff | DEq Dragons |
|---|---|---|---|---|---|
| Sibsig Appraiser | 3006 | 53.67% | 53.47% | 0.20% | 3.12% |
| Sagu Wildling | 2573 | 51.80% | 54.09% | −2.29% | 2.92% |
| Caustic Exhale | 2033 | 53.65% | 53.83% | −0.17% | 2.79% |
| Dragon's Prey | 2027 | 53.54% | 53.49% | 0.05% | 2.80% |
| Karakyk Guardian | 1965 | 53.95% | 54.02% | −0.07% | 4.17% |
| Twinmaw Stormbrood | 1772 | 55.51% | 54.54% | 0.97% | 4.83% |
| Traveling Botanist | 1638 | 54.40% | 54.77% | −0.37% | 3.43% |
| Dispelling Exhale | 1407 | 52.57% | 53.75% | −1.19% | 2.58% |
| Roiling Dragonstorm | 1384 | 53.94% | 53.67% | 0.27% | 3.37% |
| Evolving Wilds | 1316 | 54.60% | 54.57% | 0.04% | 2.63% |
Sibsig Appraiser performed about as well as DEq would expect, but not well enough to support the soft-forcing strategy. Sagu Wildling, on the other hand, essentially tanks the whole exercise. Its original DEq of +1.42% would put it above Fortress Kin-Guard, but the reweighted performance as P1P1 is absolutely abysmal. Other cards typical of having utility function in a Dragons deck, like Dispelling Exhale and Dragonstorm Globe, which didn’t even show up in the Dragons strategy due to it’s poor starting DEq value, performed similarly poorly as first picks. Ironically, Twinmaw Stormbrood, the one card on this list to significantly outperform the baseline, has exactly Boros colors.
So what’s the deal? To start with, I think this is an exciting thing to discover and was totally unexpected to me. It suggests a consistent reservoir of value not apparent to my best efforts at evaluating card quality, or anyone else’s as far as I know. Is it really as simple as forcing the best-performing deck?
Gumption Curves#
I’m not so sure. There’s something a little different going on here that I think goes beyond just being the best-performing deck. I can’t explain it yet, but I can point to a more precise phenomenon than just “Boros good”. For a while, I’ve been a little obsessed with the graphs I’m about to show you. Since I started developing my argument that ATA should be considered a component of card quality, I’ve been making these graphs of as-picked win rate versus pick number. Basically, for each card, for each position it was drafted in, what win rate was achieved in the event, regardless of play rate. Normally, these graphs slope upwards, and that slope is an important part of the justification of using ATA to correct the average win rate observed when comparing two cards against each other. I call these “signal plots” because they indicate how strongly a card’s presence late in a pack should indicate openness, but in this case we’re interested in the behavior at the beginning of the pack, not the end.
However, it doesn’t always slope, or doesn’t always slope as intensely as expected, and the intensity of the slope seems to be related to the card’s position in the metagame or function in a particular deck. Let’s look at some. I cherry-picked the examples with the starkest contrast, but was careful to pick cards that were apparently comparable in quality. Other comparisons might be noisier or less clear, but the aggregate effect of the Mardu cards sloping less steeply than the dragons cards is captured by the substitution results already shown. Because the skill of the players that prefer the cards at different picks can vary, I’ve controlled for skill within each comparison.
from deq.analytics import skill_adj_signal_plot

pairs = [
    ["Fortress Kin-Guard", "Sagu Wildling"],
    ["Sunset Strikemaster", "Karakyk Guardian"],
    ["Frontline Rush", "Roiling Dragonstorm"]
]

for pair in pairs:
    skill_adj_signal_plot('TDM', pair)
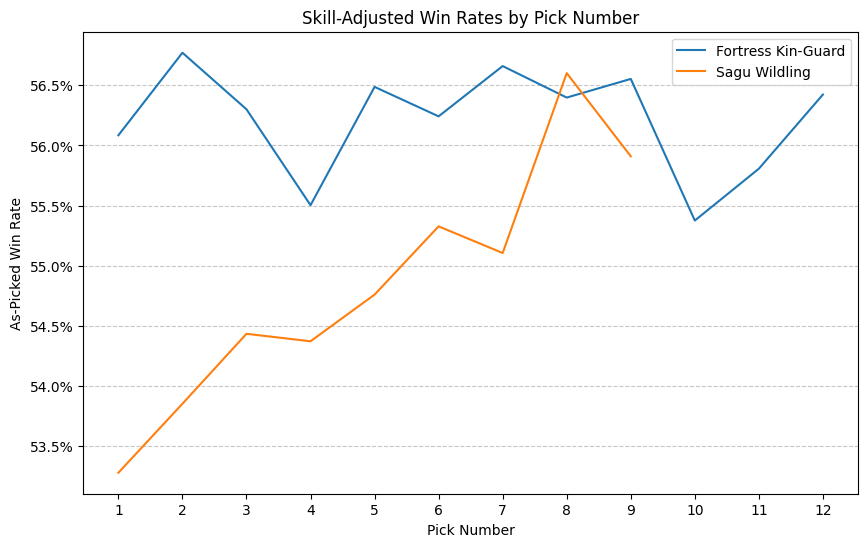
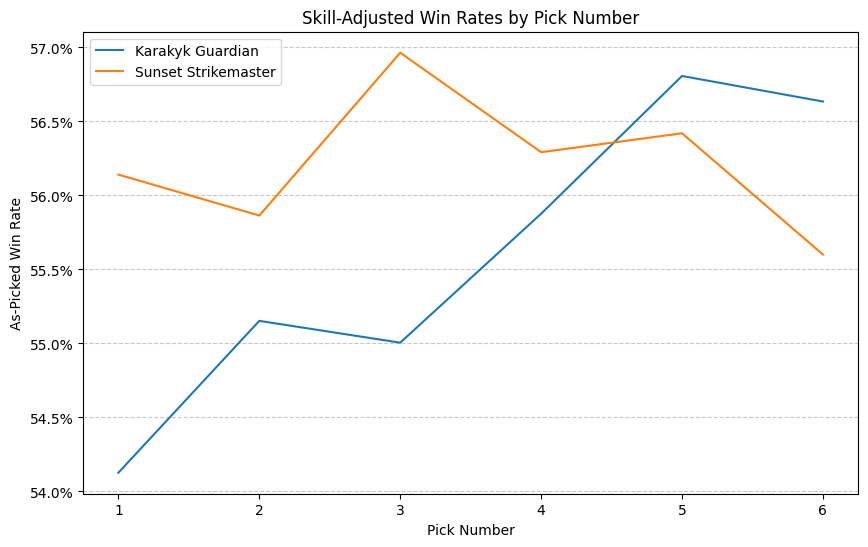
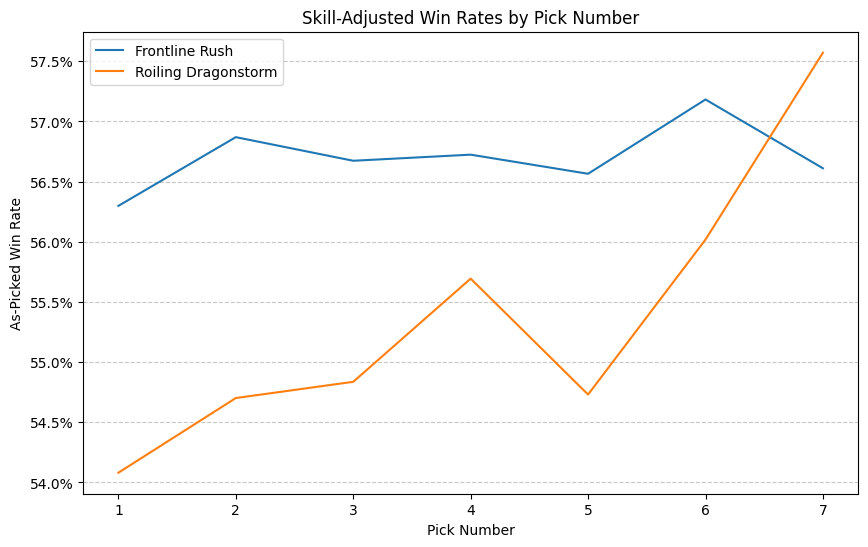
We see in each case the Boros card presenting a nearly flat win-rate curve. They perform as well or nearly as well as a first pick as they do as a sixth pick or higher, while in each case the dragon-related card increases upward by two or three percent. This effect gives us something to latch onto for observation outside of the complicated substitution analysis. We can look at these curves and, when they are unusually flat, suppose that the cards make better early picks than their win rates would suggest.
I associate this effect to a strategy coined as “gumption” on the Lords of Limited podcast, specifically identifying underdrafted strategies supported by late pick commons and moving in immediately with the confidence that you will be able to fill in the pieces of your deck. To my eye, these graphs are the graphical representation of the efficacy of that kind of strategy for certain cards. Boros was a gumption strategy in TDM, and it worked. Dragons was not, and if you didn’t start with one of the powerful bombs, it was much less likely to work.
What are the characteristics of a successful gumption strategy? Can we identify one using data in time to exploit it? I’m not sure yet. The deep bench of commons available to Boros seems to be the likely starting point, and perhaps just as importantly, the success of the archetype despite a relative lack of bomb rares. Yes, Voice of Victory and Cori-Steel Cutter were fantastic, but most of the best bombs were a better fit in the multicolor decks.
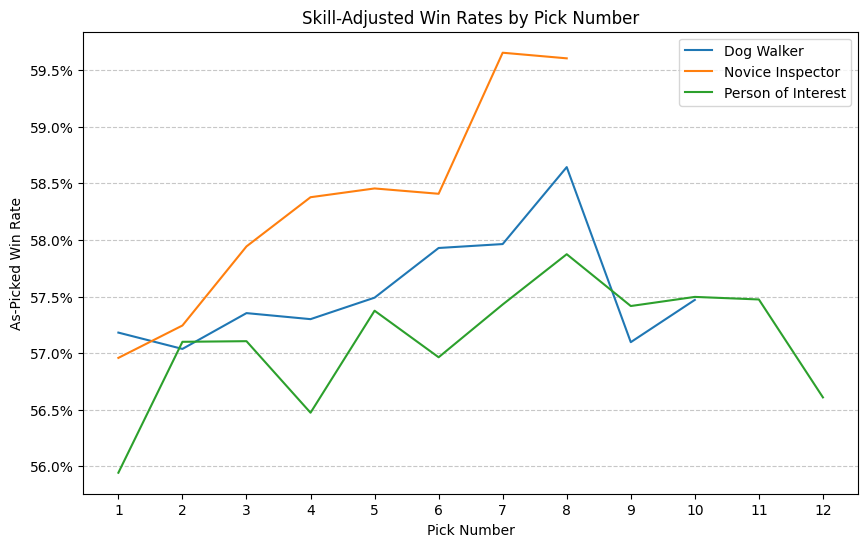
I want to show one more set of curves for some recent formats with successful Boros strategies, to see if we can visually identify a similar pattern.
skill_adj_signal_plot("MKM", ["Person of Interest", "Novice Inspector", "Dog Walker"])
skill_adj_signal_plot("MH3", ["Conduit Goblin", "Aerie Auxiliary", "Smelted Chargebug"])
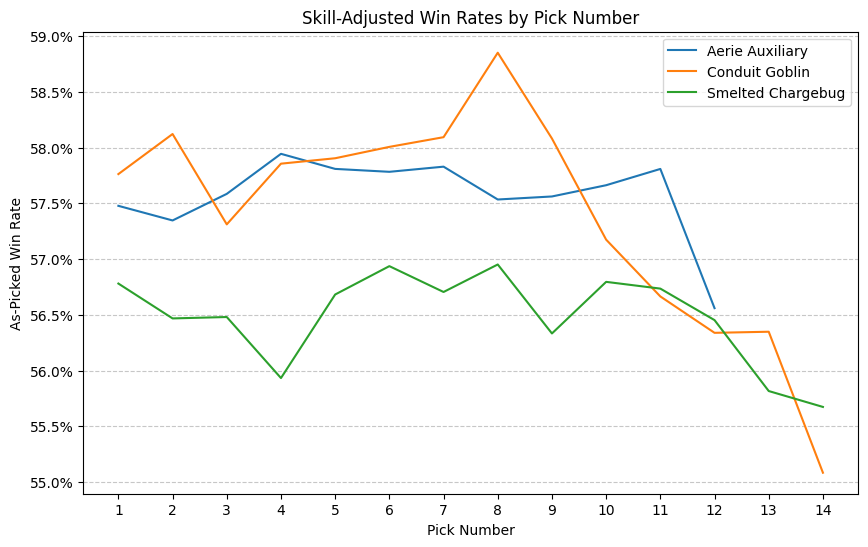
With this limited survey, my impression is that Boros was not a gumption deck in MKM, but it was in MH3. I’d expect to find that forcing WR in MH3 would perform exceptionally well just based on this chart and my memory of the format. Clearly further analysis is needed.
Conclusion#
Attempting to find solid evidence for the effectiveness of forcing strategies is a compelling problem. The potential benefits, as mentioned earlier, go beyond just a bit of value picked up with a first pick. One can gain greater expertise by focusing on a narrower range of cards. The flip side of that is that this analysis gives no insight into how tenaciously to stick to a soft-force once approached via an early pick. It could be that the advantage disappears once second and third picks are approached with a similar disregard for apparent card quality. However, I doubt that those people succeeding by first-picking Fortress Kin-Guards were finding most of their success by pivoting off of them, so we should expect a large majority of the decks to end up in those colors. Not only was Boros the best-performing deck in TDM, it was also forceable and a suitable strategy for success at the elite level.
How can we identify gumption strategies by perusing 17Lands early in the format? I don’t have the answer to that yet, but there are three criteria that seem natural. First, it should be an outperforming archetype. The outperformance of Boros in this analysis was clearly rooted in the strong performance of the deck overall. Second, there should be a deep bench of commons representing strong results within that archetype. In TDM, we had cards like Seize Opportunity, Rebellious Strike, and even Fire-Rim Form that had solid performance and were reliably available on the wheel. That can be observed by checking the ATA and GP WR numbers for commons further down the list. Lastly, look for the most powerful rares and don’t gumption the decks that those rares fit into (do take them, though!). Sagu Wildling was the worst possible gumption card because it was such good friends with cards like Ureni.
No, this advice doesn’t differ greatly from the core gumption strategy, but that’s the point of calling it “gumption”. I just hope to have provided some quantitative evidence of such a strategy being successful and repeatable.